By the numbers: Who’s going to chemistry and chemical engineering graduate school
By Andrea Widener, for C&EN

Chemistry and chemical engineering graduate school enrollment was up on average from 2007 to 2017, according to data from the Council of Graduate Schools (CGS). The CGS releases data every year analyzing a decade of US graduate school enrollment and degree awards. This department-specific data, which are not publicly available, can help disciplines see trends in first-time and total enrollment, including demographic changes. The most recent survey looks at data from the years 2007–17.
Total and first-time average annual enrollment in chemistry graduate programs was slightly up, compared with a small decline in 2006–16. The increase carried across demographic groups except for black students, whose enrollment decreased a small amount on average each year across the 10-year period. The average annual percent increase in enrollment of Hispanic students in chemistry grad programs was far above other demographic groups at 13.1% for first-time enrollment and 9.8% for total enrollment.
The average annual enrollment increases were higher across the board for chemical engineering, with an overall percent change of 3.6% in first-time enrollment and 3.2% in total enrollment. First-time enrollment of Hispanic students was particularly high, at an average annual increase of 17.3%, followed by first-time enrollment of Asian and Pacific Islander students at 6.0%.
In both fields, a large proportion of students are temporary residents in the US on a visa. For chemical engineering, more than half of first-time enrollees in 2017—1,035 of 1,939—were temporary residents. For chemistry, the numbers are lower at 35%, or 1,485 of 4,252.

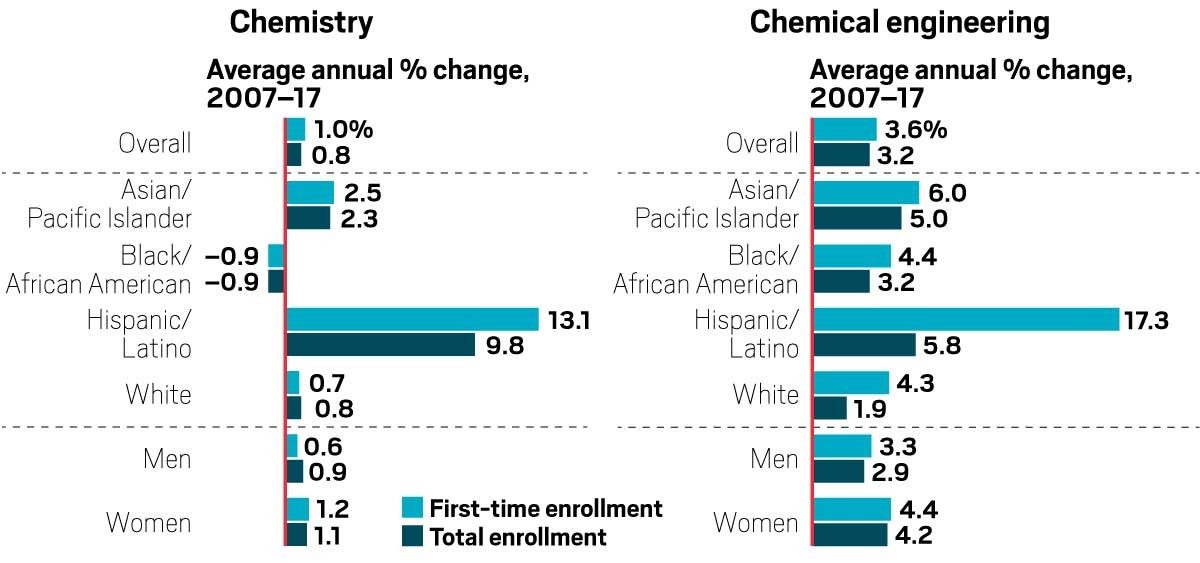
How did grad school enrollment change from 2007 to 2017?
Enrollment of Hispanic students was the major growth area for both chemistry and chemical engineering between 2007 and 2017. The bump was especially large for first-time enrollment in chemical engineering, which saw an average annual increase of 17.3% during that period. More women enrolled in both disciplines, with an increase of 1.1% in chemistry and 4.2% in chemical engineering.
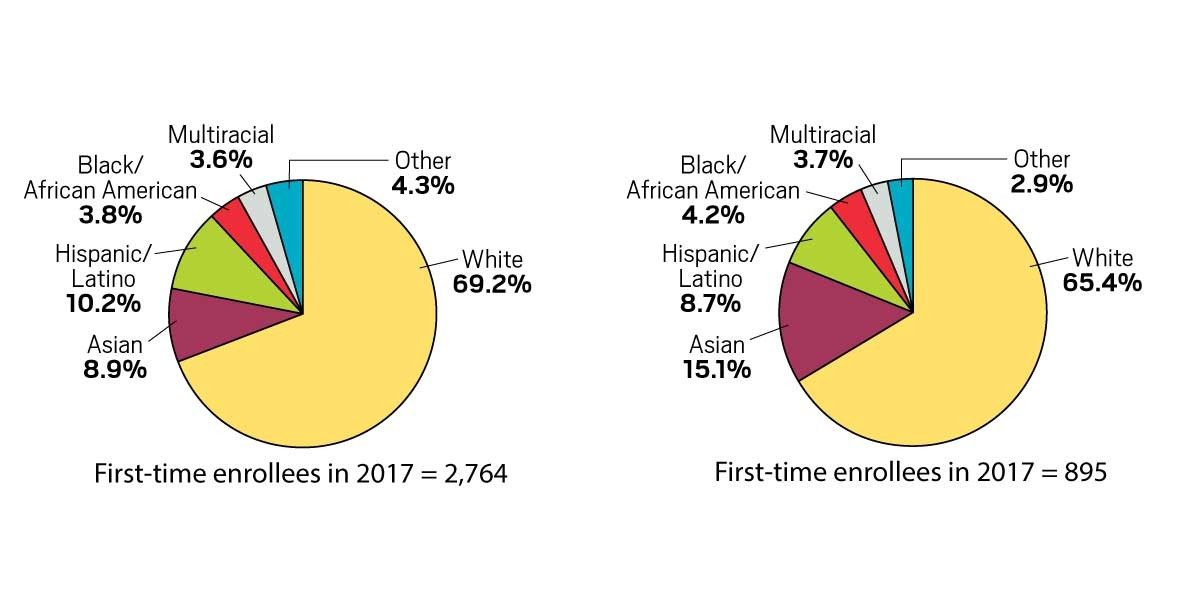
Who is going to graduate school?
White students still make up the majority of both chemistry and chemical engineering first-time enrollees who are US citizens or permanent residents. But Hispanic students came in second in chemistry in 2017 at 10.2%, and Asian students were second in chemical engineering at 15.1%.
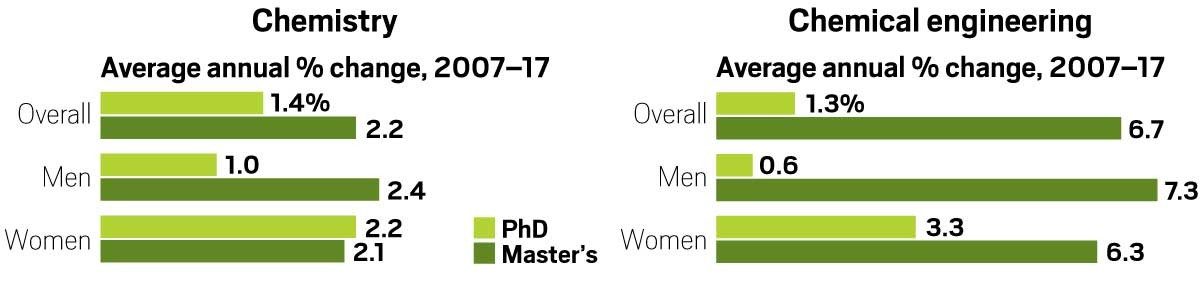
Who is graduating?
The number of degrees awarded increased across the board, most notably for female chemical engineers.