Know Your Techniques: Nuclear Magnetic Resonance Spectroscopy (NMR)
In organic chemistry laboratory you will learn lots of new techniques to make, purify, and analyze molecules. Some of them are fun, while others can be frustrating. Nuclear magnetic resonance spectroscopy, or NMR, is an analysis technique that often falls on the frustration end of the spectrum. But with a tiny amount of sample and a few minutes in a powerful magnetic field, NMR can give you detailed information about the structure of a molecule, the nature of its bonds, and the environment of individual atoms—all without harming the sample! Whether you love it or hate it, there is no denying the power of this analytical technique to help you learn a molecule’s structure.
Because so much information can be extracted with NMR, it is a key tool in many fields of research, including medicine, agriculture, even battery development. Whereas techniques like mass spectrometry and FT-IR can tell you about the mass and functional groups of a molecule, NMR can deduce the actual structure of environmental contaminants, reaction intermediates, and more. It’s even used in medical testing, where it’s more commonly known as magnetic resonance imaging (MRI).
Granted, interpreting the results of an NMR analysis to get valuable information can be tricky, but your first step is always getting the very best NMR spectrum of your sample that you can. Here’s how you do it.
Before you start
Remember what NMR is
NMR = magnet + radio pulse
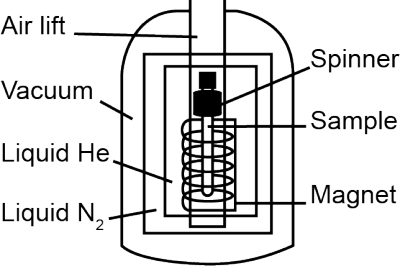
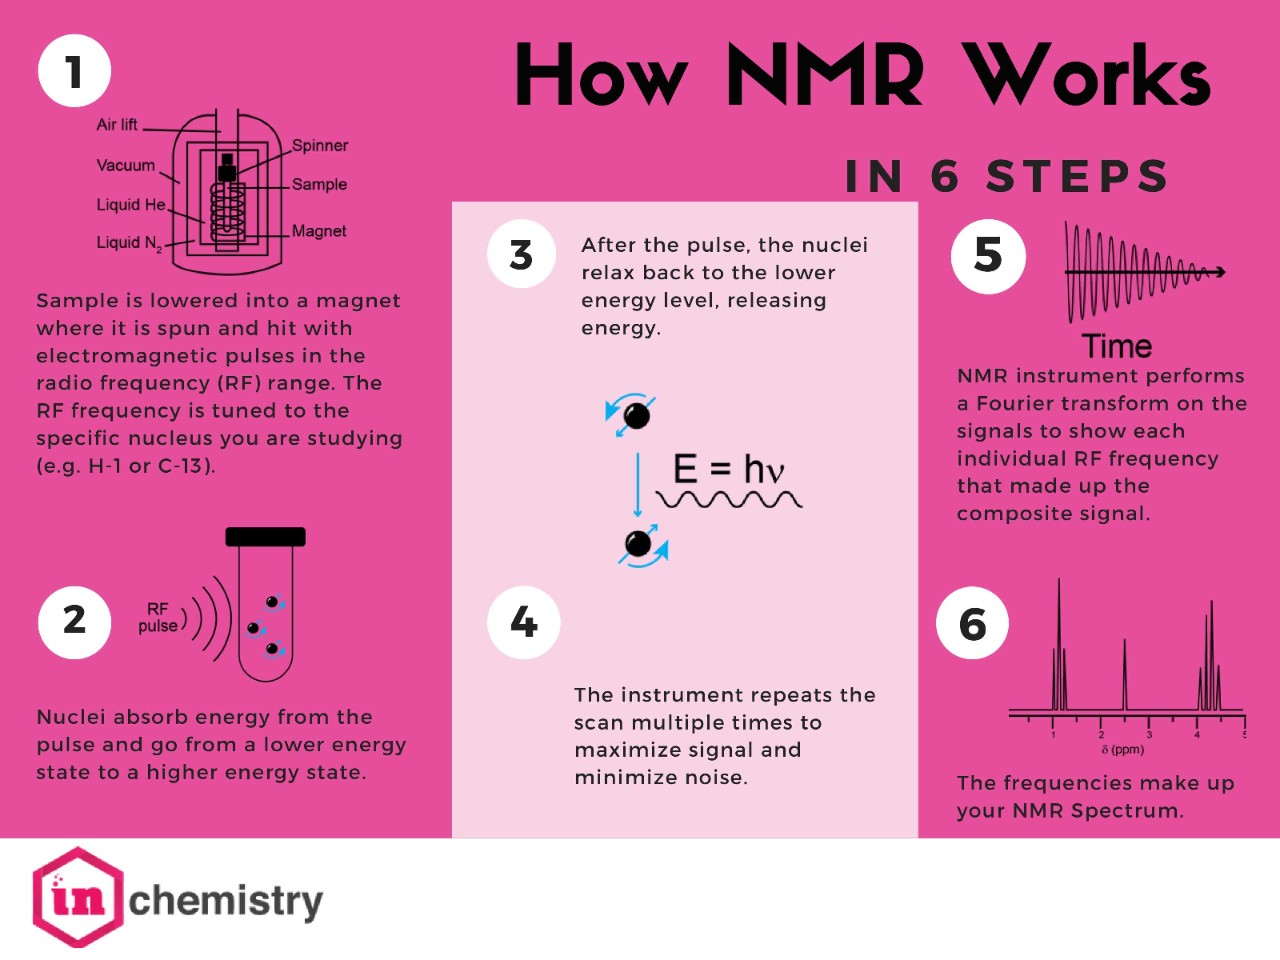
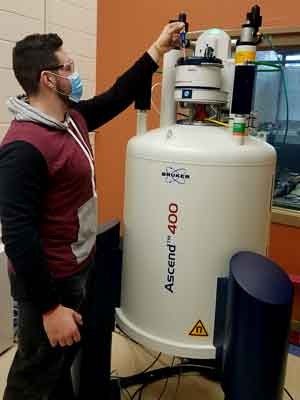
The heart of the NMR instrument is an electromagnet made of superconducting metals cooled to near absolute zero using liquid helium. You’ll be lowering your sample into the magnetic field where it will spin and be hit with electromagnetic pulses in the radio frequency (RF) range. The frequency of these pulses is tuned to the specific nuclei that you will be studying. The nuclei will absorb energy from the pulse and go from a lower energy state to a higher energy state. Once the pulse has ended, the nuclei relax back to the lower energy level, releasing an energy signal.
The instrument repeats the scan to maximize the signal and minimize noise (your instructor will advise you on how many times it should be repeated). Then it collects the signals and performs a Fourier transform to convert the collected signal into a spectrum showing each individual RF frequency that made up the composite signal. These frequencies make up your NMR spectrum. NMR instruments vary in size according to magnet strength (reported in MHz). There are tabletop NMR instruments that fit on a lab bench all the way to instruments that are taller than an average person and take up their own special room. These instruments are expensive and delicate, so stay focused and follow directions. You don’t have to be scared to take your spectra, but do your best to be very careful.
Know what NMR technique you need
NMR is great for any type of nucleus that has an odd mass number. For most organic chemistry courses, you collect 1H (proton) and 13C (carbon-13) NMR spectra. Samples are usually in solution, because allowing the molecules to move freely will help average their signals.
Other techniques are possible. You can tune your NMR spectrometer to other nuclei, such as 15N or 31P. With specialized equipment, you can collect solid-state NMR spectra of samples that can’t be dissolved. You could also use different frequencies in the same analysis for more specific structural and electronic information in two-dimensional NMR.
Remember the huge magnet
Most modern instruments have very good shielding on the magnets so you no longer have to worry about the NMR spectrometer pulling your keys from across the room or your jewelry getting stuck to the instrument. That being said, even shielded instruments can wipe clean things like magnetic key cards, so check with your instructor about magnetically sensitive items, like credit cards or pacemakers, before you go near the instrument. Your instructor may have additional recommendations—be sure to follow them!
Running an NMR sample
1. Prepare the sample
NMR is quite sensitive, so all you need is a small amount of your sample (about 50 mg). Your product should be as pure and as dry as possible. Any residual solvents, water, or other impurities will show up in your spectrum, making it difficult or even impossible to read which peaks you want.
In most cases, you will run solution-phase NMR. Whether you have a liquid or solid sample, you’ll dissolve it in a low-viscosity, deuterated solvent (i.e., a solvent in which the 1H atoms have been replaced with deuterium 2H atoms). Why deuterated? Most instruments need a signal that is independent of your sample to use as a reference—or lock—signal. The deuterium signal(s) of the deuterated solvent acts as the reference signal.
Because it is impossible to get truly pure deuterated solvents, good solvents tend to be very simple compounds with few hydrogens. You’ll also want to choose a solvent whose peaks don’t overlap with your sample. In some cases, a tiny amount of tetramethylsilane [Si(CH3)4] may also be added as another reference point.
2. Load the sample
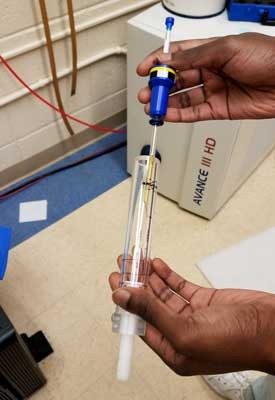
Once you have prepared your sample, you will put it into a long skinny tube called an NMR tube. Cap the tube, and then slide it into a little jacket-like outer tube called an NMR spinner. The spinner helps position the tube correctly in the NMR instrument, so make sure it’s at the right height. If your sample doesn’t have the spinner on, or if it is too low in the spinner, it could crash to the bottom of the magnet. You’ll want your instructor to check the height before you move on.
Right before you place the tube in the spectrometer, carefully wipe it down. This removes trace oils or impurities that might interfere with the spinning or show up on your spectrum. Then immediately set the sample on the air current at the top of the magnet. From there, the instrument will lower the sample to begin scanning.
3. Run the analysis
Each brand and type of NMR instrument has its own instructions for use. Your instructor will tell you how to have your instrument run the rf pulses and collect the results.
Once the NMR data are collected, the instrument will raise the tube back up using the air current. Be sure to pull your tube straight up and all the way out of the instrument when you are collecting it. If you are not careful, it is easy to break the tube as you remove it.
Now that you’ve collected your data, you can analyze it!
How to read your spectrum
The first thing to realize is that you are not cheating when you try to imagine what your spectrum should look like. You should be able to have a good estimate of how many peaks will show in your spectrum and the type of chemical shift they should have. The first thing we recommend you do when you get a spectrum is draw out the molecule on the worksheet and think about the unique chemical environments. Here are two examples:
Example 1
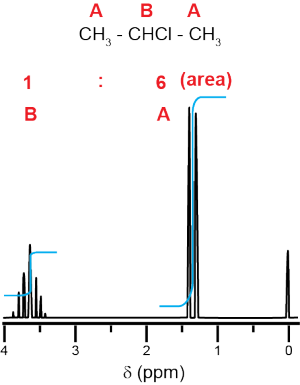
For 2-chloropropane, there are two unique types of carbon, labeled A and B, and only two types of hydrogen, also A and B. Symmetry means that even though there are three carbons and seven hydrogens, there are only two unique types of carbon and two unique types of hydrogen. There will be two peaks in the 13C NMR spectrum and two peak areas in the 1H NMR spectrum. Carbon B is bonded directly to the Cl and is more partially positive than carbon A.

Because carbon B, and the hydrogen on carbon B, are more deshielded, they will have higher chemical shifts (the higher the number of ppm, the more to the left the peak will be on the spectrum) than carbons A and the hydrogens on the two carbons A (which will be the peak closer to zero in the spectrum). Integration of the proton NMR spectrum will have the ratio of peaks be 6 Ha : 1 Hb. Hydrogen B has six neighboring protons (three each from the two carbons A), and so its peak will be split into seven peaks. Hydrogen A has one neighboring proton and so its peak will be split into two (a doublet).
Example 2
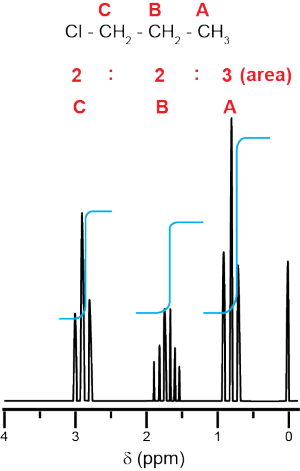
For 1-chloropropane, every carbon is different; therefore Ha hydrogens are different from Hb hydrogens and Hc hydrogens. There will be three peaks in both the 13C and 1H NMR spectra. Carbon C is the most deshielded (most partially positive) and will have the highest value chemical shift. Carbon A is the most shielded (least deshielded) and will have the lowest chemical shift. The integration of proton NMR will be 3 Ha : 2 Hb : 2 Hc, and the peaks will be split according to their neighbors. The Ha and Hc hydrogens each have two neighbors (the two Hb protons) and will be split into three peaks (a triplet). The Hb hydrogens have five neighbors (Ha and Hc) and will be split into six peaks.
Interpreting the data
Interpreting an NMR spectrum takes practice. You’ll get lots of opportunities to practice in class, but you should also seek out more practice opportunities from textbooks, old exams, or websites.
Here is a basic guide to interpreting your data:
Chemical shift (how close electrons are to nuclei)
The individual peaks in your spectrum are chemical shifts that tell you about your atom’s environment. Each nucleus will feel a local magnetic field generated by the electrons surrounding it in either bonds or lone pairs. This localized magnetic field will “shield” the nucleus from the much larger field from the magnet of the NMR instrument. Every atom will feel the external magnetic field differently as a function of how shielded it is. The less shielded an atom is, the more partially positive, the higher the absorbed frequency, and the larger the chemical shift. Typically, chemicals are measured relative to Si(CH3)4 and reported in ppm.
For 13C NMR, the chemical shifts range from 0 to around 200 ppm. The well-shielded carbon nuclei—the ones that are not very polar—will have low chemical shifts. Simple sp3 C-H hydrocarbons will have shifts from from approximately 0 to 30 ppm. Carbons bonded to electronegative elements like N or O will be more partially positive, and thus more deshielded. They will absorb higher frequencies and have a larger shift, from around 30 to 80 ppm. Aromatic carbons appear in a range from around 110 to 150 ppm, and very partially positive carbons like those in carbonyls are very deshielded and appear in the 160-200 ppm range.
For 1H NMR, the chemical shifts range from 0 to around 14 ppm. The environments of the carbon help dictate the environments of the protons on the carbon. The more partially positive a carbon is, the more deshielded the proton will be and the higher its chemical shift value will be. Protons on those simple sp3 C-H hydrocarbons will show up between 0 and 3 ppm. Protons on aromatic carbons will show up from 6.5 to 8 ppm. The proton on a carboxylic acid group is extremely deshielded and will show up as high as 12 ppm.
Your organic chemistry textbook likely includes a table of these values. With a few essential guideposts (like the values listed above) and some understanding of polarity, you can make some educated guesses as to relative values, even when you don’t have the table in front of you.
Number of peaks (symmetry)
With NMR, every peak corresponds to a unique type of the atom you’re analyzing. Having four peaks in your 13C NMR spectrum doesn’t necessarily mean you have four carbons. You might have more than four carbons in your compound if there are two carbons that have the exact same chemical environment. If there is symmetry, meaning if the carbons have exactly the same shielding, those carbons will all be one peak (see sidebar for an example). All you can know is that with four peaks, you have four unique types of carbon.
For 1H NMR, most often every hydrogen on a carbon will be identical to the others on the same carbon. Since there are often multiple H’s on the same carbon, many peaks in the proton NMR spectrum will end up representing more than one H. Again, the information about number of peaks is that the number of peaks corresponds to the number of unique proton environments.
Integration (how many of each type of proton)
Information you collect about integration and splitting applies to proton NMR. For proton NMR, the area under the peak corresponds to the number of protons that contributed to the peak. This is usually automatically calculated by the NMR software on your computer, using integration, and expressed as a ratio. If the integration of two peaks is 60:40, it could mean that the ratio is 3 H on one carbon to 2 H on another carbon, or it could be 6 H’s on two identical carbons to 4 H’s on two other identical carbons. This is where, if you are taking a sample you made in lab, looking at the chemical structure of your compound (or at least knowing the formula) becomes extremely handy.
Splitting (how many neighboring protons)
A very cool thing about proton NMR is that the proton on one carbon is impacted by protons on neighboring carbons. How a peak splits, where one peak becomes two (a doublet) or three (a triplet) or more, is a direct outcome of how many neighboring hydrogens your peak’s hydrogens have. Integration tells you how many hydrogens contribute to a specific peak; splitting tells you what is nearby. The splitting follows an n+1 rule, so if your H has no neighboring H’s, the peak is just a normal unsplit peak. If there is one H on a neighboring carbon, the peak will be split into two (a doublet). If there are two H’s on a neighboring carbon (or carbons), 2+1 = 3 and the peak is split into three (a triplet), and so on. When figuring out splitting, every neighboring H counts—even if those H’s are identical (see sidebar for an example).
Extra peaks = solvent and impurities and standards
What if you have more peaks than you expect? First of all, you should expect to see solvent peaks depending on your solvent and your type of scan. You will see peaks for CDCl3 in both 13C and 1H NMR. The carbon NMR spectrum will show three peaks centered at 77 ppm. Even though it is deuterated, you will always have some CHCl3 in your deuterochloroform (and it appears at 7.26 ppm). Tetramethylsilane (TMS) is a standard included in some NMR solvents that shows up at 0 ppm in both proton and C-13 NMR spectra. Other peaks can be assigned to expected impurities. Acetone is a common impurity because it is almost ubiquitous in chemical cleaning and washing. Side products may appear as smaller intensity additional peaks.
Need more help?
Here are some recommended websites to check out:
Compound Interest has great infographics to use as reference tools when analyzing your spectra.
SciFinder is a tool produced by the Chemical Abstracts Service (CAS) that allows you to search for individual chemicals through CAS numbers and find physical properties, including NMR spectra.